
Report - Selection Results Dashboard
The selection results dashboard page in the report.pdf gives a quick overview how the dataset selected by LightlyOne differs from a random selection of the same number of samples.
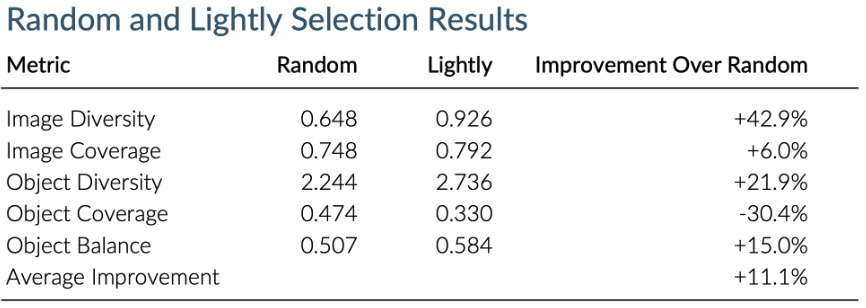
The image diversity measures the diversity of the selection in the image embedding space. The image coverage measures how well the selection covers the input image embedding space. A more detailed explanation is available when following the links. The object diversity and coverage are the same metrics but computed in the object embedding space instead of the image embedding space.
The object balance measures how balanced the dataset is with respect to the object classes in it.
To make all metrics in the dashboard such that higher is better, they are defined as follows:
- Diversity = mean distance from a sample to its closes neighbor
- Coverage = 1 / ( 1 + mean distance from each input sample to its closest selected neighbor)
- Balance = entropy of class distribution normalized to be in [0, 1]
In all cases, the metric value of the selection done by LightlyOne and defined by your selection configuration is compared to a random selection of the same size.
Note that these metrics do not necessarily reflect the relevant properties of the selected subsets for your use case. Furthermore, the dashboard is independent of your selection config. For example, if you specify active learning in the selection config, the average active learning score is not included in this dashboard but can be seen in later parts of the report. Similarly, thresholding and selection based on metadata are not reflected in the dashboard.
Updated 11 months ago